

For most of the past decade, growth in medical aesthetics has been a non-surgical story. Neurotoxins and fillers were where the volume was, where the marketing went, and where the industry trained its attention. Plastic surgery was an invasive, high-commitment category that was often talked about as if it were on the way out.
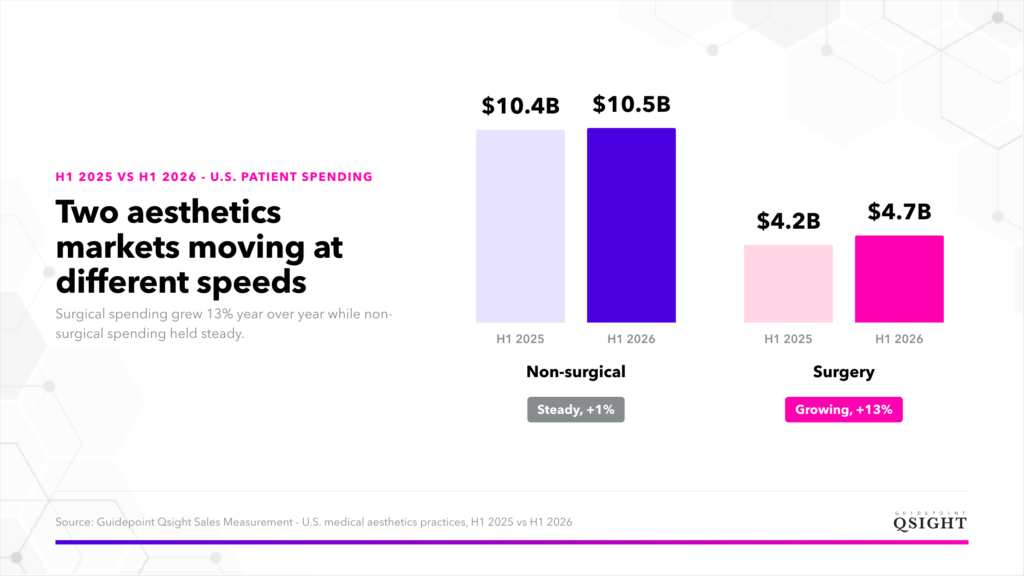
But the first half of 2026 broke the pattern. Non-surgical patient spending at U.S. medical aesthetics practices remained steady between H1 2025 and H1 2026. Over the same period, patient spending on plastic surgery grew 13% to $4.7 billion, according to Qsight Sales Measurement data.
Surgical spending reached $2.4 billion in Q2 2026 alone, up 19% year over year, with facial surgeries up 30%. So—what’s happening?
Plastic Surgery Industry Trends 2026: Key Takeaways
- Plastic surgery patient spending reached $4.7 billion in H1 2026, up 13% year over year from $4.2 billion.
- Non-surgical patient spending was close to flat over the same period, at $10.5 billion against $10.4 billion a year earlier.
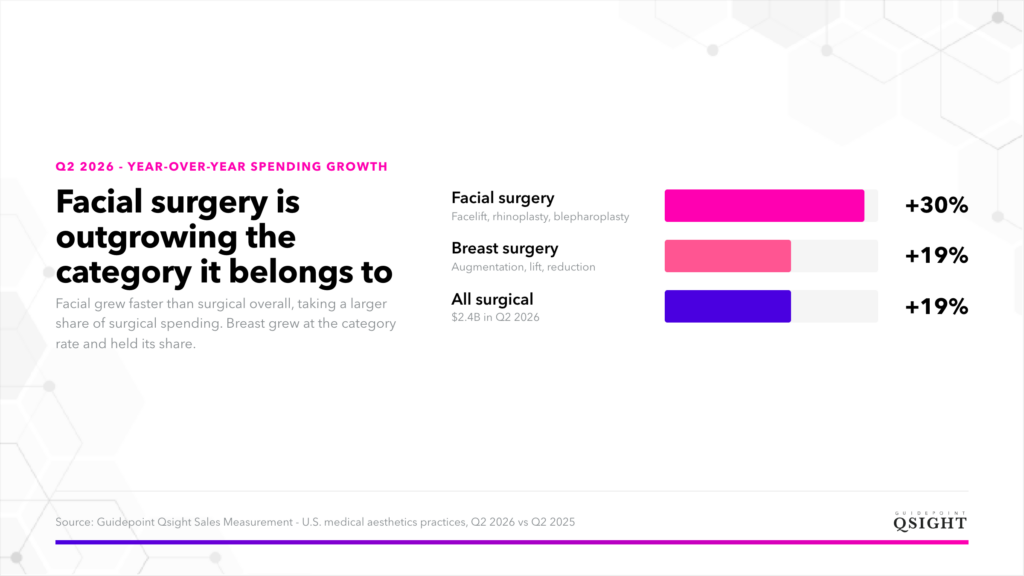
- Surgical spend hit $2.4 billion in Q2 2026, up 19%, with facial surgeries up 30% and breast surgeries up 19%.
- Facial surgery grew faster than the surgical category it belongs to, which means it gained share of surgical spending. Breast surgery grew in line with the category and held its share.
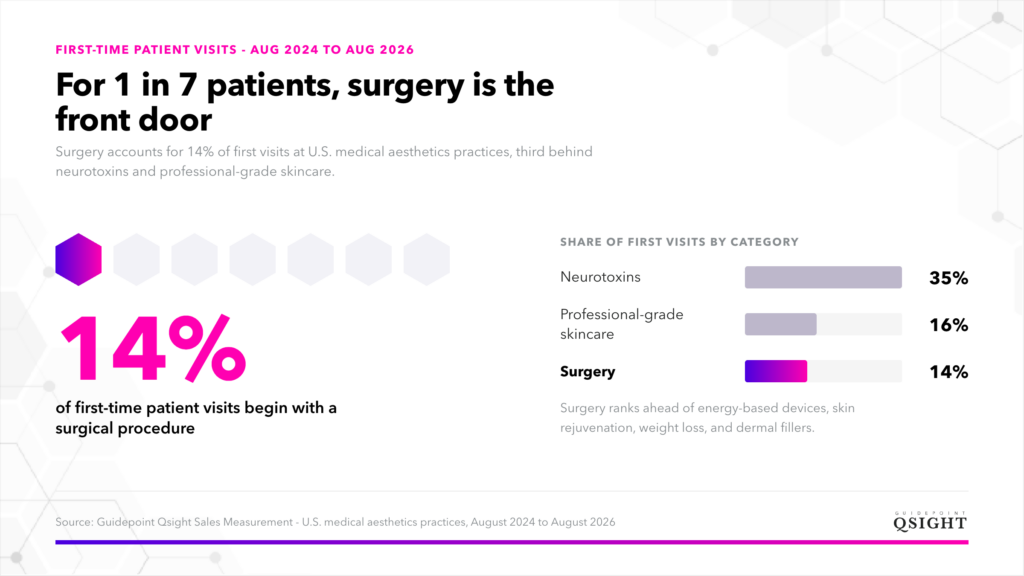
- Surgery accounts for 14% of first-time patient visits at U.S. medical aesthetics practices, ranking third behind neurotoxins and professional-grade skincare.
How Much Are Patients Spending on Surgical Aesthetics?
Plastic surgery generated $4.7 billion in patient spending at U.S. medical aesthetics practices during the first half of 2026, up from $4.2 billion in the first half of 2025. Many commercial teams still treat surgical as a mature, slow-moving category, but 13% year-over-year growth suggests otherwise.
Compared against non-surgical spending’s steady but flattening growth, that rate stands out. Non-surgical patient spending totaled $10.5 billion in H1 2026, against $10.4 billion in H1 2025. Non-surgical is still the larger category by a wide margin, but it has stopped compounding at the rate the industry got used to.
What Counts as Surgical Aesthetics?
Surgical aesthetics covers procedures performed in an operating room or surgical suite, typically under anesthesia. The main groupings are facial surgery, including facelift, rhinoplasty, and blepharoplasty; breast surgery, including augmentation, lift, and reduction; and body procedures such as liposuction and abdominoplasty.
This is distinct from minimally invasive and non-surgical treatments, which include neurotoxins, dermal fillers, energy-based device procedures, professional-grade skincare, and skin rejuvenation. Both are part of the medical aesthetics market, but they operate at different price points, have different visit patterns, and now have different growth rates.
Which Procedures Drove Q2 2026 Surgical Growth?
Surgical patient spending reached $2.4 billion in Q2 2026, up 19% year over year. Facial surgeries grew 30%, and breast surgeries grew 19%.
At 30% growth, facial surgery outgrew the category that contains it, meaning it took a larger share of surgical spending than it held a year ago. Breast surgery grew at the category rate, holding its share while the category expanded underneath it.
Facial is where surgical spending is concentrating at present, a key distinction for anyone allocating commercial resources.
Why Is Facial Surgery Growing Fastest?
Several forces outside the transaction data point in the same direction. Celebrity candor about facial procedures has made facial surgery a normal topic of public conversation, and surgeons in the news media have described patients arriving with more information and less hesitation about specific techniques. Take Kris Jenner’s open discussion of her own facelift in Vogue Arabia’s September 2025 issue, where she named her surgeon and framed the decision as her way of aging gracefully.
Surgeons interviewed across the trade and consumer press consistently describe patients wanting to look like refreshed versions of themselves rather than visibly altered. Deep plane technique has become central to that desire, with several surgeons reporting that they’ve seen more patients under 50 electing it as an earlier preventive measure.
GLP-1 medications could also be reinforcing the trend from an unexpected direction. As GLP-1s become more accessible and more patients seek treatment related to rapid weight loss, procedures like facial fat grafting can be an answer for restoring lost volume.
What’s Driving Breast Surgery Growth?
As with any category change, many factors can be at play at once. But the timing is interesting here, as the breast augmentation category recently got its first structural change in over a decade.
In September 2024, the FDA approved Establishment Labs’ Motiva implants for primary and revision breast augmentation, the first new breast implant to receive U.S. premarket approval since 2013. And Qsight practitioner research showed continued increases in breast implant procedures using these devices through late 2025.
Notably, Motiva advertises a Preservé technique, touted as a less invasive, low-impact option designed to be performed under twilight rather than general anesthesia and to preserve more natural breast tissue. Having more options in the market widens what surgeons can offer and gives patients a reason to reconsider a procedure they may have deferred.
Surgery as a Patient Acquisition Channel
Surgical procedures are usually framed as high-ticket transactions inside an existing patient relationship, but the first-visit data complicates this notion.
Surgery accounts for 14% of first-time patient visits at U.S. medical aesthetics practices, based on Qsight Sales Measurement data covering August 2024–August 2026. That ranks it third, behind neurotoxins at 35% and professional-grade skincare at 16%, and ahead of energy-based devices, skin rejuvenation, weight loss, and dermal fillers.
For roughly 1 in 7 patients, surgery is their first direct encounter with aesthetics. That changes how surgical growth should read in a practice’s economics and in a manufacturer’s view of the patient pathway. Practices with surgical capability aren’t only capturing higher-value procedures from existing patients; they’re also using surgery to bring patients in.
What Surgical Growth Means for Aesthetics Manufacturers and Investors
For finance and executive leadership: Forecasts built on a blended market growth rate will understate surgical and overstate non-surgical at the same time. Board conversations about where the business is exposed should reflect the divergence rather than a single category number.
For commercial and sales leadership: Growth concentrated in facial and breast procedures means territory design and rep coverage weighted toward those specialties will capture more of it. Practices doing volume in facial surgery are a different target profile from medspas doing volume in injectables.
For brand, insights, and corporate development: Aesthetics manufacturers planning implant and capital equipment demand need surgical’s trajectory separated from blended category assumptions. For anyone evaluating assets, the divergence changes which parts of the market carry growth and which carry maturity.
Are Patients Trading Injectables for Surgery?
The data doesn’t establish that. Two segments growing at different rates isn’t evidence that the same dollars moved between them. But the data does show that surgical demand is expanding faster than non-surgical demand over the same months, in the same practices, measured the same way.
How to Track Surgical Aesthetics Spending in Near-Real Time
Most published cosmetic surgery statistics measure procedure counts, telling you what happened last year. But they don’t answer what the category is worth, where dollars are concentrating, or how quickly either has changed. Quarterly transaction data tells you what’s happening now. That’s enough to make the difference between reacting to a market change and planning for one.
Qsight Sales Measurement tracks patient spending across surgical and non-surgical categories at U.S. aesthetic practices and medspas, by category, brand, geography, and patient demographic, updated monthly. This transaction-level data comes directly from practice point-of-sale systems, capturing what patients paid, in which category, at which practice type, without relying on recall or estimation.
Aesthetics Is Two Markets Moving at Different Speeds
The industry’s read on aesthetics growth was calibrated to injectables for good reason. That’s where the volume, the innovation, and the data were, and in ways still are. Neurotoxin patient spending reached an all-time high of nearly $1.8 billion in Q2 2026, up 9% year over year, and neurotoxins remain the most common category for a patient’s first visit to an aesthetics practice.
But H1 2026 says some degree of recalibration may be in order. Surgical spending grew 13% while non-surgical spending stayed steady, putting the two segments at rates far enough apart that a blended view of the category hides both the opportunity and the exposure. The teams that separate the two will see what a single growth curve conceals.
Want the Full H1 2026 Category Breakdown?
Download the Qsight Medical Aesthetics 2026 Mid-Year Update for patient spending and growth data across every major surgical and non-surgical category.