


TL;DR: Guidepoint Qsight has launched the Cross-Purchasing Dashboard, a transaction-backed patient journey analytics tool that reveals which aesthetic treatments and products patients purchase together and how those combinations shift over time. Powered by Qsight’s proprietary data from U.S. aesthetic practices and medspas, it covers neurotoxins, dermal fillers, skincare, energy-based devices, and more, going back to 2018.
At the start of 2018, roughly 20% of neurotoxin procedures at U.S. aesthetic practices were performed alongside a dermal filler treatment. By Q1 2026, that share had dropped to 13%, according to Qsight data.
That’s seven percentage points; a decline that, for most aesthetics brands, went completely undetected. As it turns out, the category pairing they’d long treated as set in stone had been eroding for years.
Understanding patient purchasing behavior in medical aesthetics has historically relied on what sales reps observe in the field, what practitioners report, and what the industry has simply assumed to be true. The problem is, none of that scales or updates in real time.
But with the launch of Guidepoint Qsight’s Cross-Purchasing Dashboard, the industry is getting a purpose-built patient journey analytics platform for tracking how aesthetic patients actually spend across treatments and products.
Patient Cross-Purchasing Data for Medical Aesthetics: Key Takeaways
- Neurotoxin procedures account for roughly 34% of all first-time non-surgical aesthetic patient visits, but the traditional assumption that patients pair them with dermal fillers is weaker than most brands think.
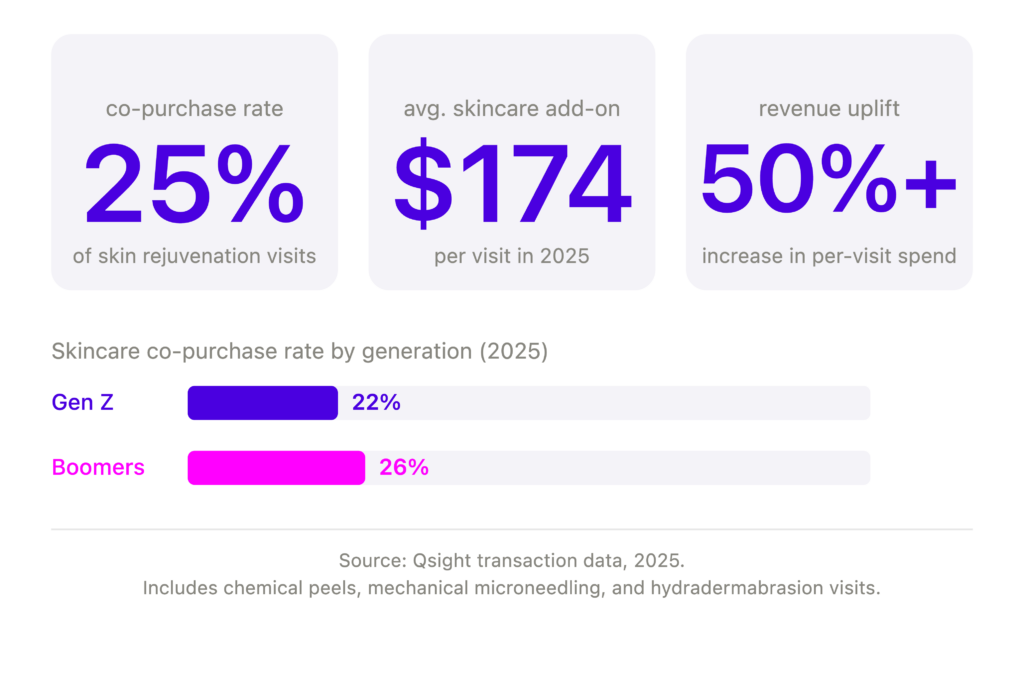
- In 2025, professional-grade skincare added an average of $174 per visit when paired with skin rejuvenation procedures, increasing total visit revenue by 50% or more.
- Cross-purchasing rates vary by patient age: Gen Z patients included a skincare purchase in 22% of qualifying visits vs. 26% for Boomers.
- Cross-purchasing rates can be tracked over time by category, brand, and patient cohort, which means brands can measure whether bundling promotions and co-marketing campaigns are actually changing how patients spend.
Why Patient Purchasing Behavior in Medical Aesthetics Has Been So Hard to Track
For most of aesthetics’ growth era, commercial strategy has been built on a reasonable but imperfect foundation: sales volume data, rep observations, and category assumptions refined over years of field experience. That foundation works well enough for understanding what’s selling, but it breaks down when you need to understand what’s selling alongside what, and whether those relationships are strengthening or weakening over time.
Treatment co-purchasing analytics, the kind that maps which treatments and products patients combine within a visit or across a defined time window, has simply been unavailable at scale in this industry. As Erik Haines, Managing Director of Guidepoint Qsight, noted at launch:
“Historically, much of the understanding around patient behavior and treatment pairing was anecdotal or intuition-based, largely due to lack of good data and information at scale. Our new dashboard connects these dots with real data.”
The Cross-Purchasing Dashboard is built on Qsight’s proprietary transaction dataset, sourced directly from practice point-of-sale systems rather than surveys or modeled proxies. That means the data reflects what patients are actually doing in treatment rooms, not just what practitioners recall or estimate.
How Is Cross-Purchasing Data Different from Sales Measurement Data in Medical Aesthetics?
Sales measurement data tells you how much of a product or category is selling, where, and to whom. Cross-purchasing data tells you what patients are buying alongside it. They’re complementary: Qsight’s Sales Measurement tracks volume and share, while the Cross-Purchasing Dashboard maps the relational patterns between categories and brands within and across patient visits.
The Neurotoxin Data: A Gateway Category with a Shifting Pairing Story
The neurotoxin category is a good illustration of what the dashboard can uncover: data points that challenge assumptions brands have held for years.
Neurotoxins Are the Top Gateway Treatment in Aesthetics
According to Qsight transaction data from the past two years, neurotoxin procedures account for approximately 34% of all first-time non-surgical aesthetic patient visits. That makes them the single most common entry point into aesthetics, with real downstream implications for patient acquisition, retention, and lifetime value. Roughly 40% of first-time neurotoxin patients return for a subsequent treatment within six months, growing to approximately 50% within twelve months.
As Erika Sheyn, SVP of Aesthetics at Guidepoint Qsight, put it:
“As the industry continues to grow, Qsight’s Cross-Purchasing Dashboard will provide manufacturers valuable guidance to better and more quickly understand patients’ evolving relationship with medical aesthetics.”
The Neurotoxin-Filler Co-Purchase Rate Has Been Declining for Years
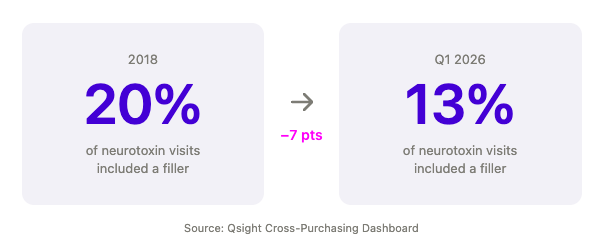 The co-purchase rate for neurotoxins and dermal fillers peaked at around 21% in 2017 and had fallen to 13% by 2025, according to Qsight Sales Measurement data. That decline tracks closely with broader softness in the filler category: total dermal filler spending fell 7% in 2025, per Qsight Market View. Within that, HA filler patient spending declined from $3.2B in 2023 to $2.7B in 2025, while biostimulatory fillers grew from $0.76B to $0.83B over the same period.
Patients aren’t abandoning fillers entirely, but they are becoming more selective about which fillers they choose and choosing different combinations. That’s exactly the kind of category-level shift that cross-purchasing data surfaces before it shows up in a rep’s anecdotal read of the market.
Skincare Cross-Purchasing Is Driving Measurable Per-Visit Revenue
In 2025, 25% of all non-energy-based skin rejuvenation visits, including chemical peels, mechanical microneedling, and hydradermabrasion, also included a professional-grade skincare purchase, according to Qsight transaction data. Those additions averaged $174 per visit and increased total patient spend by 50% or more relative to the procedure alone.
That rate also varied across patient demographics. Gen Z patients included a skincare purchase in 22% of qualifying visits; Boomers did so in 26%. For brands designing skincare bundling programs or targeting specific age cohorts, that gap is a more reliable starting point than assumptions about which patients are most interested in skincare.
What Aesthetic Basket Analysis Adds
The Cross-Purchasing Dashboard tracks these behaviors across six categories:
- Neurotoxins
- Dermal Fillers
- Energy-Based Devices
- Professional Grade Skincare
- Hormone Replacement Therapy
- Weight Loss
These are all filterable by brand, patient age cohort, practice type, geography, and time period, with data going back to 2018.
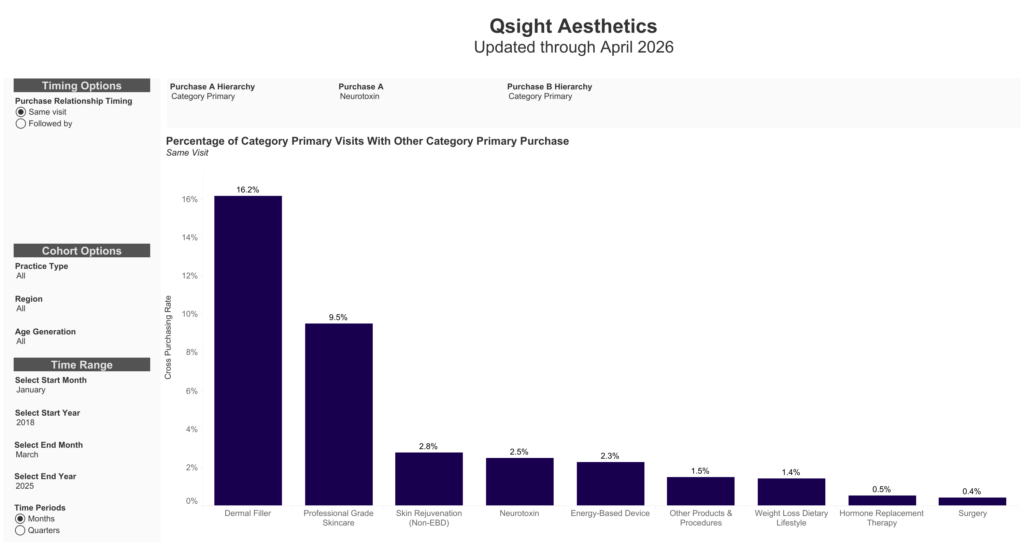
The dashboard’s aesthetic basket analysis capability identifies which categories tend to co-occur, how frequently, and whether those affinities are strengthening or softening over time. That historical depth is what lets brands distinguish a structural shift from a single-year anomaly.
How Far Back Does Qsight’s Cross-Purchasing Data Go?
The dashboard includes transaction data going back to 2018, providing roughly eight years of trend visibility at time of launch. That depth is unique in the industry, and it makes a major difference for aesthetic manufacturers and brand teams. That’s because behavioral shifts in aesthetics often unfold gradually.
The neurotoxin-filler co-purchase decline, for example, dropped from 21% to 13% over eight years. A single year of data would have rendered that trend invisible.
Turning Cross-Purchasing Data into Commercial Strategy
The dashboard’s core use cases map closely to the decisions aesthetics commercial teams face most often.
Brand Partnerships & Bundling
If Qsight data shows that a significant share of patients receiving Treatment A also purchase Brand B’s product within the same visit, that’s a signal worth exploring for a co-marketing relationship. The dashboard makes those affinities visible at the brand level, not just the category level, which is where partnership decisions actually get made.
Bundling programs benefit from the same specificity. Promotions built on assumptions about what patients “tend to combine” carry risk when those assumptions haven’t been tested against transaction data. The dashboard grounds those decisions in verified purchasing behavior and tracks whether a bundle is actually moving co-purchase rates over time.
Campaign Performance Measurement
One of the more underused applications of cross-purchasing data is as a measurement tool for marketing. If a co-promotional push between two treatment brands was designed to increase co-purchase frequency, the dashboard can tell you whether it did and by how much. That’s a level of campaign attribution that’s historically been difficult to establish in aesthetics.
Product Launch and Innovation Planning
Understanding what patients already purchase around a category is highly useful context for a new product launch. It identifies natural adjacencies, reveals which patient cohorts are already engaged in relevant treatment combinations, and flags where category relationships are strengthening or softening.
The Cross-Purchasing Dashboard is built on the same transaction dataset that powers Qsight Sales Measurement, making the two a natural pairing for teams that want both volume-level and relationship-level visibility into patient spending.
What the Data Is Telling the Aesthetics Industry
The neurotoxin-filler story is useful precisely because it illustrates that category assumptions in aesthetics have a shelf life. Patient behavior evolves, treatment preferences shift, and the commercial relationships between categories change in ways that aren’t visible from the point of sale alone.
The Cross-Purchasing Dashboard gives aesthetics brands a fundamentally different angle on how their category fits into the patient’s broader spending behavior, across time, geography, and demographics. The brands that act on that medical aesthetics patient journey data will be better positioned to design bundling strategies, build partnerships, and launch products that align with where patients are actually headed.
Ready to see the data behind your patients’ treatment journeys? Request a demo of the Qsight Cross-Purchasing Dashboard to explore what verified cross-purchasing analytics can surface for your commercial strategy.